Overview
Contribution Analytics goes beyond simple commit counts to analyze the characteristics, complexity, and impact of each contribution. The system categorizes contributions into meaningful segments that help identify work patterns and contributor specializations.Quadrant Classification System
The Four Contribution Quadrants
Every contribution is automatically classified into one of four categories based on impact and effort analysis:- 🟢 High Impact, High Effort: Major features, significant refactoring, and architectural changes
- 🟡 High Impact, Low Effort: Critical bug fixes, security patches, and targeted improvements
- 🔵 Low Impact, High Effort: Documentation updates, test additions, and infrastructure work
- ⚪ Low Impact, Low Effort: Minor tweaks, typo fixes, and routine maintenance
Impact Calculation
Impact is determined by analyzing:- Files Modified: Number and type of files affected
- Lines Changed: Total additions and deletions
- Code Complexity: Structural changes to the codebase
- Review Activity: Discussion volume and reviewer engagement
Effort Assessment
Effort metrics consider:- Development Time: Time between commits and PR lifecycle
- Revision Cycles: Number of review iterations required
- Change Scope: Breadth of modifications across the codebase
- Testing Requirements: Associated test changes and coverage impact
Visual Analytics
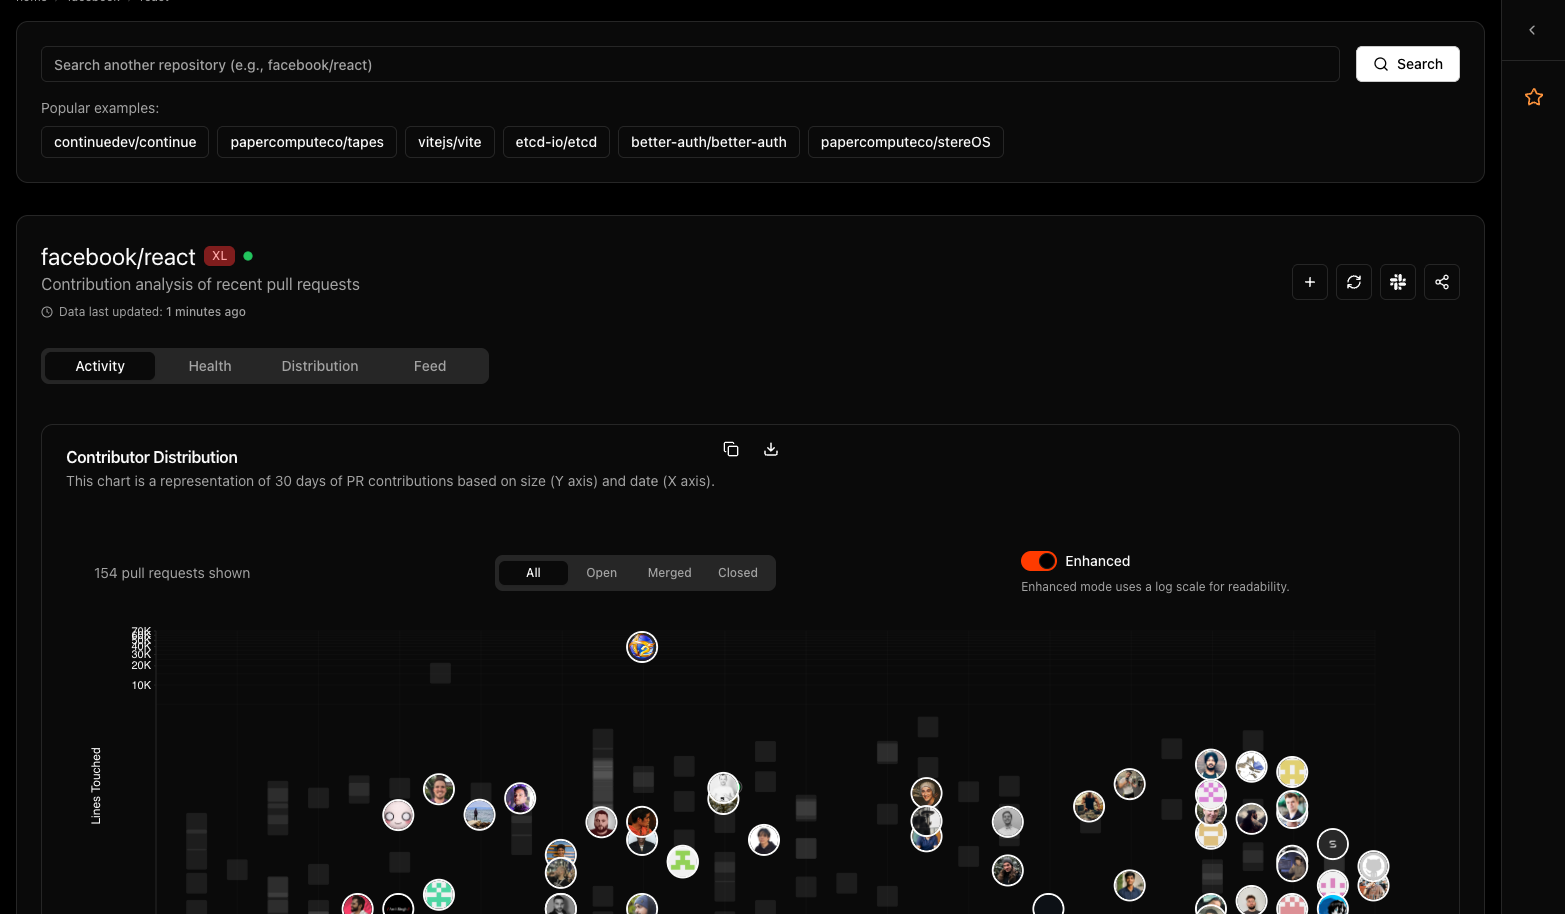
Scatter Plot Visualization
The analytics display contributions as an interactive scatter plot that visualizes the distribution of contributions over time. The chart shows:- Unique Contributors: Up to 50 unique contributor avatars on desktop (25 on mobile) are displayed as interactive elements
- Duplicate Contributions: When the same contributor has multiple PRs, subsequent contributions appear as subtle gray squares
- Visual Hierarchy: Contributor avatars always render on top of gray squares for better visibility
- Time Distribution: Contributions are plotted across the selected time range. Desktop uses the configured range (30 days by default), while mobile uses a shorter fixed window for readability and performance.
Contributor Mapping
Each contributor’s work patterns become visible through their distribution across the timeline, revealing activity patterns and collaboration dynamics.Insights and Patterns
Contributor Specialization
Analytics reveal contributor expertise areas:- Feature Developers: Contributors concentrated in high-impact, high-effort quadrant
- Maintainers: Balanced distribution across all quadrants
- Bug Fixers: High activity in high-impact, low-effort area
- Infrastructure Contributors: Focus on low-impact, high-effort improvements
Project Health Indicators
Quadrant distribution reveals project characteristics:- Feature-Heavy Projects: High concentration in major development quadrants
- Mature Projects: Balanced distribution with emphasis on maintenance
- Rapid Development: High velocity in quick-impact areas
- Technical Debt Focus: Emphasis on high-effort, infrastructure improvements