Overview
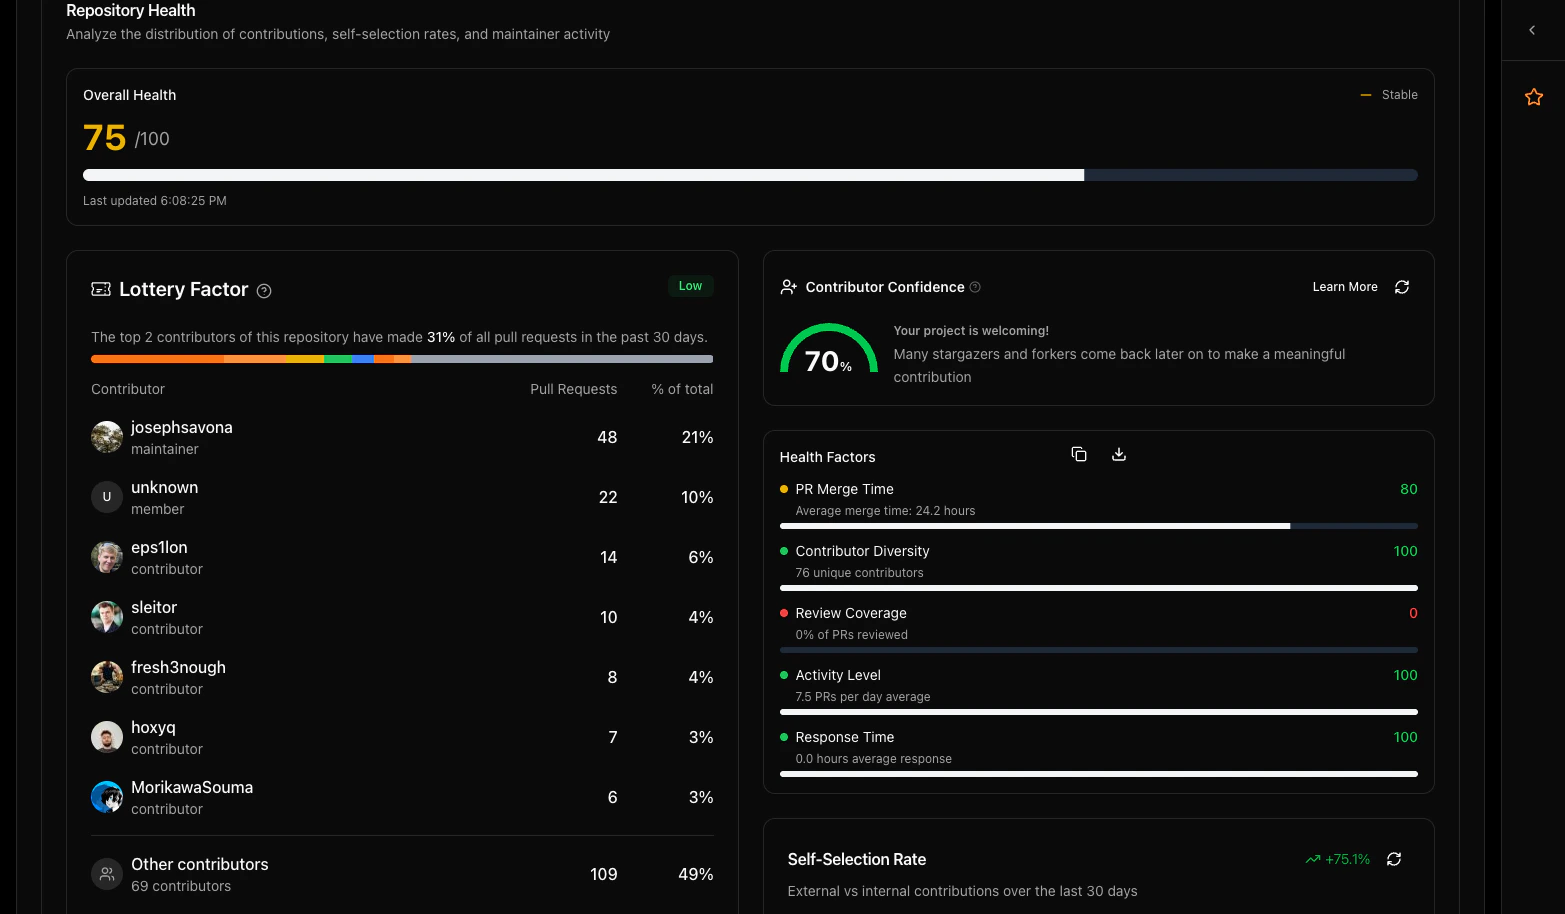
The health dashboard aggregates multiple metrics into a unified view of repository wellness, combining contributor distribution analysis, workflow efficiency metrics, and community engagement indicators to provide actionable insights for project sustainability.Core Health Metrics
Contributor Distribution Health
Assessment of how well contributions are distributed across the team:- Lottery Factor Risk: Concentration risk analysis and sustainability assessment
- Active Contributor Count: Number of regular contributors within the time period
- New Contributor Integration: Rate of new contributor onboarding and retention
- Contributor Diversity: Balance of contribution types and expertise areas
Workflow Efficiency Indicators
Metrics that reveal how effectively the development process operates:- Average PR Merge Time: Speed of code review and integration processes
- Review Response Time: How quickly PRs receive initial attention and feedback
- PR Success Rate: Percentage of PRs that successfully merge versus those that are closed
- Stale PR Management: Number and age of PRs that remain open without activity
Visual Health Indicators
Color-Coded Status System
The dashboard uses intuitive color coding to quickly communicate health status:- 🟢 Green (Healthy): Metrics within optimal ranges indicating strong project health
- 🟡 Yellow (Attention): Metrics suggesting areas that need monitoring or improvement
- 🔴 Red (Critical): Metrics indicating significant risks or immediate attention requirements
- ⚪ Gray (Insufficient Data): Areas where more data is needed for accurate assessment
Trend Analysis
Historical comparison shows whether health metrics are improving, stable, or declining over time, helping identify emerging issues before they become critical.Health Dimensions
Sustainability Assessment
Long-term project viability indicators:- Knowledge Distribution: How well project knowledge is spread across contributors
- Maintenance Capacity: Ability to handle ongoing maintenance and bug fixes
- Growth Potential: Indicators of project’s ability to attract and retain new contributors
- Technical Debt Management: Balance between feature development and maintenance work
Community Vitality
Measures of community engagement and growth:- Contributor Retention: How long contributors remain active with the project
- Mentorship Activity: Evidence of experienced contributors helping newcomers
- Discussion Quality: Depth and constructiveness of project discussions
- Recognition Culture: How well the project celebrates contributor achievements
Actionable Recommendations
Risk Mitigation Strategies
The dashboard provides specific recommendations based on identified health issues:- High Lottery Factor: Suggestions for knowledge sharing and contributor development
- Slow PR Processing: Workflow optimization recommendations and reviewer capacity planning
- Low Contributor Diversity: Strategies for attracting contributors from different backgrounds
- Declining Activity: Engagement and motivation improvement suggestions
Growth Opportunities
Identification of areas where the project can expand and improve:- Underutilized Contributors: Contributors with recent commits but limited review or issue ownership, flagged as candidates for expanded code ownership or triage roles
- Skill Gap Analysis: Technical areas that need more contributor expertise
- Process Improvements: Workflow optimizations that could increase efficiency
- Community Building: Opportunities to strengthen project community
Example: Reading a Health Report
Illustrative example — actual score bands depend on your repository’s metrics. For example, a repository might show a Health Score of 58 (yellow):- Losing 1–2 key contributors would halt most feature work — distribute ownership.
- A 6-day merge time indicates review bottlenecks; add reviewers or adjust PR size.
- Increasing active contributor coverage can help improve the overall health score.
Integration with Other Features
Cross-Feature Analysis
The health dashboard combines insights from multiple contributor.info features:- Lottery Factor Integration: Sustainability risk assessment
- PR Activity Correlation: Workflow efficiency analysis
- Distribution Insights: Technical diversity and balance evaluation
- Contributor Profiles: Individual impact on overall project health